Email Reports
JemRF Monitoring sends daily summary Email Reports
User options in the Communications Settings section can be used for when and to whom to send Email reports. The Scheduled Emails will show statistics for all active sensors over the last 12 or 24 hours, User option.
The following is the body of a sample email message:
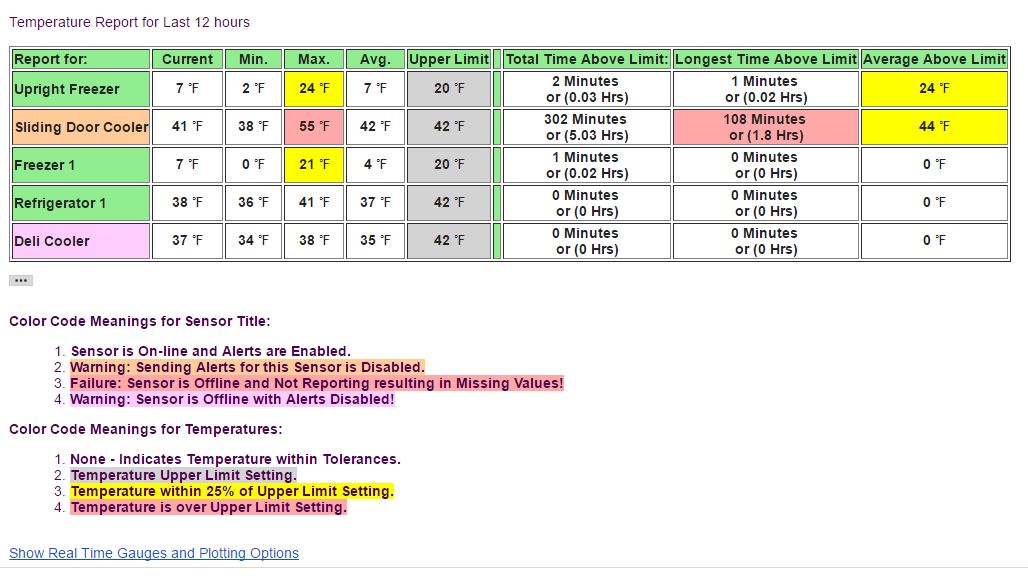
This example shows as many of the different statuses and states for sensors as we press into one screen.
For each of the sensors being monitored you get current reading, maximum, minimum and average for last 12 hours,
You can see the first upper limit level and how long it may have been above that level over the last 12 hours,
and more importantly, what was the longest continuous block of time it was above that limit.
There is a color code chart at the bottom, the first set is the background for the sensor name.
The second color set is for the temperatures to visually flag tolerance issues.
Included at the bottom of the Email is a link to your Temperature Monitoring Web page.
User options in the Communications Settings section can be used for when and to whom to send Email reports. The Scheduled Emails will show statistics for all active sensors over the last 12 or 24 hours, User option.
The following is the body of a sample email message:
This example shows as many of the different statuses and states for sensors as we press into one screen.
For each of the sensors being monitored you get current reading, maximum, minimum and average for last 12 hours,
You can see the first upper limit level and how long it may have been above that level over the last 12 hours,
and more importantly, what was the longest continuous block of time it was above that limit.
There is a color code chart at the bottom, the first set is the background for the sensor name.
The second color set is for the temperatures to visually flag tolerance issues.
Included at the bottom of the Email is a link to your Temperature Monitoring Web page.