Real-Time Reports
JemRF Monitoring provides option to view near realtime status of all the sensors on your Gateway.
This example shows a web status page monitoring 6 temperature sensors, a contact attached to a door and a sensor
monitoring the AC facility Power.
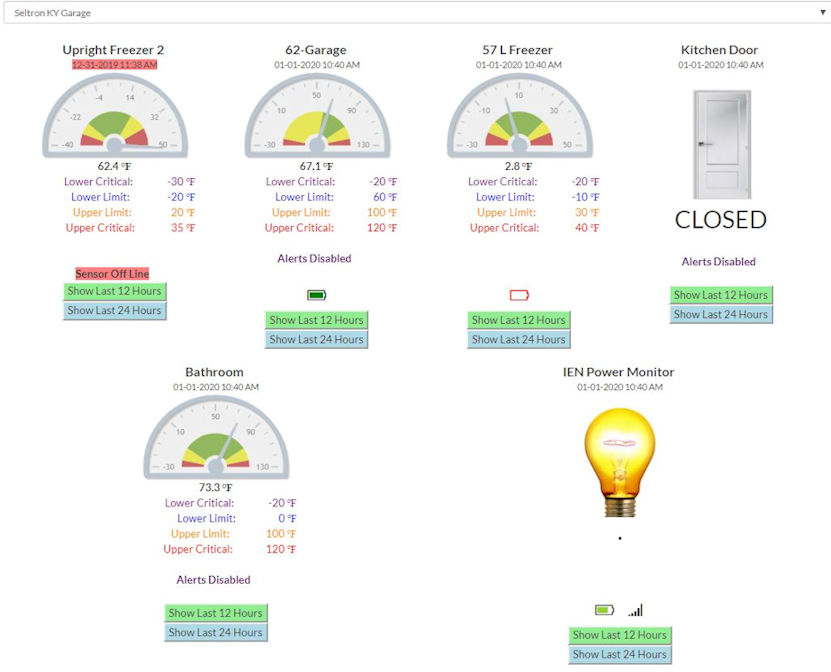
The graphics show in green the normal operating range, with red and yellow for crossing the various limits.
When the temperature crosses a limit for more that the preset max time, if alerts are enabled, the system
will send an alert either by Email or Text Messages (SMS), user option.
In this example, we can see that four of the sensors have their alerts disabled. This is often done when
the operating conditions of a refrigerator or freezers temperature swings between extremes.
See sensor placement to see examples.
There are two plot buttons for each sensor that will graph the temperature for the last 12 or 24 hours. That
plot appears below the second row of sensor meters.
The Temperature Monitoring Web Page
This example shows a web status page monitoring 6 temperature sensors, a contact attached to a door and a sensor
monitoring the AC facility Power.
The graphics show in green the normal operating range, with red and yellow for crossing the various limits.
When the temperature crosses a limit for more that the preset max time, if alerts are enabled, the system
will send an alert either by Email or Text Messages (SMS), user option.
In this example, we can see that four of the sensors have their alerts disabled. This is often done when
the operating conditions of a refrigerator or freezers temperature swings between extremes.
See sensor placement to see examples.
There are two plot buttons for each sensor that will graph the temperature for the last 12 or 24 hours. That
plot appears below the second row of sensor meters.